Dollar Cost Averaging – Configuration of Investment Strategies
Dollar Cost Averaging – Configuration of Investment Strategies
Welcome to the installment of our ‘Configuration of Investment Strategies’ series. In this article, we venture into the realm of Dollar Cost Averaging (DCA) and our table “Equity with investing” and its impact on investment strategies. DCA is a disciplined approach that involves making regular, fixed-dollar investments regardless of the asset’s price. It’s a strategy that aims to reduce the impact of market volatility on investment returns. Let’s delve into what Dollar Cost Averaging entails, exploring its positive aspects and potential drawbacks.

What is Dollar Cost Averaging?
Dollar Cost Averaging is an investment technique where an investor commits to investing a fixed amount of money at regular intervals, regardless of the asset’s price. This strategy ensures that the investor buys more shares when prices are low and fewer shares when prices are high. The goal is to spread the investment over time, reducing the impact of market fluctuations on the overall cost of acquiring the investment.
The Positive Side of Dollar Cost Averaging
- Mitigation of Market Volatility: DCA helps to smooth out the impact of market volatility by spreading investments over time. This can be particularly advantageous in volatile markets, as it reduces the risk of making significant investments at unfavorable price points.
- Disciplined Investing: DCA instills discipline by encouraging regular contributions to the investment portfolio. Investors adhere to a set schedule, promoting a consistent and long-term approach to wealth accumulation.
- Emotional Stress Reduction: By automating investments at regular intervals, DCA can help reduce the emotional stress associated with trying to time the market. Investors can stay focused on their long-term goals without being swayed by short-term market fluctuations.
The Negative Side of Dollar Cost Averaging
- Potential Opportunity Cost in Bull Markets: In consistently rising markets, DCA may result in an opportunity cost as the investor misses out on larger gains that could have been achieved by investing a lump sum at the beginning of the period.
- No Guarantee Against Losses: While DCA aims to reduce the impact of market downturns, it doesn’t guarantee protection against losses. If the market experiences a prolonged decline, the overall value of the investment can still decrease.
- Requires Continuous Cash Flow: Implementing DCA requires a consistent cash flow for regular investments. This might be challenging during periods of financial strain or economic downturns.

Results of Strategies
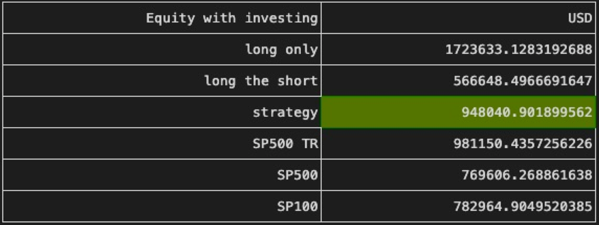
In our table “Equity with investing” we are investing not only a lump sum of money at the beginning of the backtest period, in this case $100 000 but also $1000 at the beginning of every rebalancing period. Getting the following results. The total invested money is $100 000 + 187 months * $1000 = $287 000.
- Long Only Strategy with Dollar Cost Averaging: Equity at the End of the Period: $1,723,633.13. The Long Only strategy, when combined with Dollar Cost Averaging, demonstrated substantial growth, reaching an impressive end-of-period equity. This suggests that the combination of a lump sum investment and regular contributions contributed to a robust portfolio performance.
- Long the Short Strategy with Dollar Cost Averaging: Equity at the End of the Period: $566,648.50. The Long the Short strategy, known for risk control through shorting stocks, also exhibited as expected lower growth than the long-only.
- Long and Short Strategy with Dollar Cost Averaging: Equity at the End of the Period: $948,040.90. The comprehensive Long and Short strategy, incorporating both long and short positions, showed a balanced performance with Dollar Cost Averaging. This strategy seems to maintain its appeal, providing a combination of growth and risk management.
Benchmarking Equity
- S&P 500 Total Return (SP500 TR): Equity at the End of the Period: $981,150.44. The Equity with DCA for the S&P 500 TR index reflects solid growth, showcasing the effectiveness of Dollar Cost Averaging in a broad market context.
- S&P 500: Equity at the End of the Period: $769,606.27. The S&P 500 index, a reflection of the overall market, also benefited from Dollar Cost Averaging, yielding positive results.
- S&P 100: Equity at the End of the Period: $782,964.90. As a key benchmark, the S&P 100 index exhibited growth with Dollar Cost Averaging, providing a reference point for evaluating the performance of the investment strategies.
Was the articles useful for you? Contact us and use Strategies Configurator for building and evaluating your investment strategies. If you want more info about how we use the rating of the stocks to create the different strategies read about it here.
